Market Update: 23 April 2020
Correlations are useful but not always predictable.
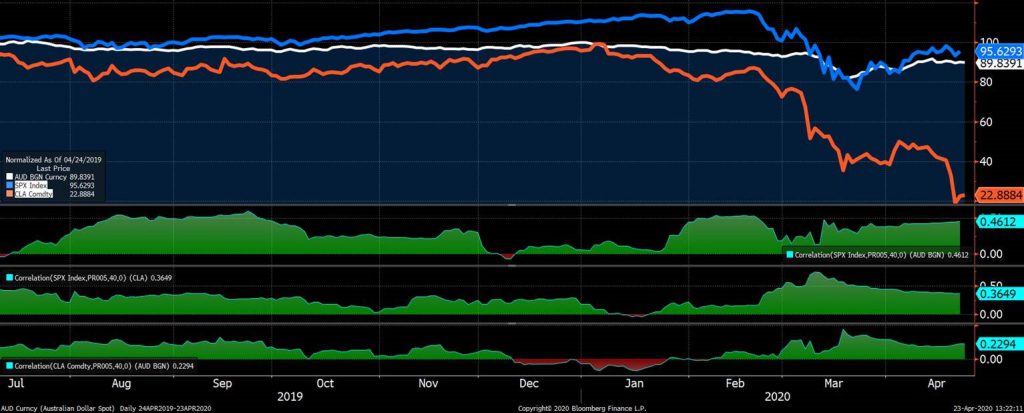
AUD can tend to have a high correlation to S&P in good times, yet missed the bus through Q4 ’19 as we grappled with Unemployment and Low Inflation concerns. In other words issues of a domestic nature.
If we consider Oil vs AUD again, there’s some pretty decent correlation going on, but fairly different fundamentals at present – we’re not even a net exporter (OK crude yes, but refined no), but Australia is a commodity currency and so their demand fortunes are intertwined.
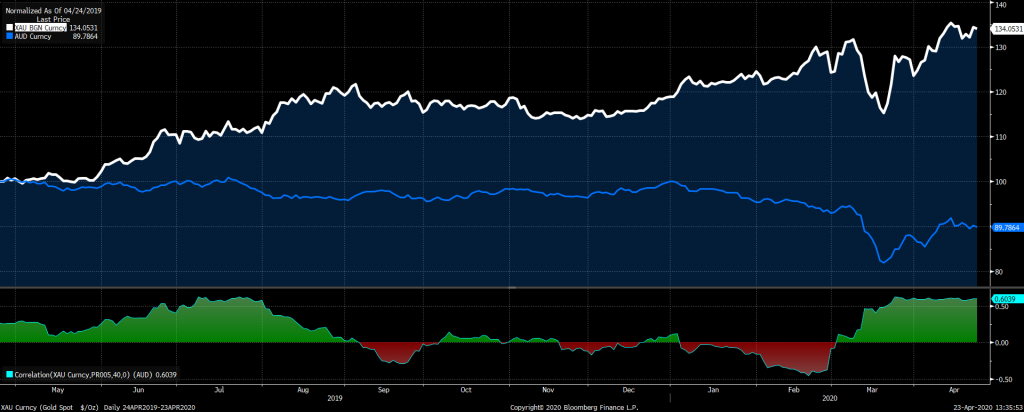
So if we then look at Gold vs AUD, that’s highly correlated as we’re an exporter right? Well not always… risk aversion tends to see AUD lower and Gold higher as seen below – especially in February.
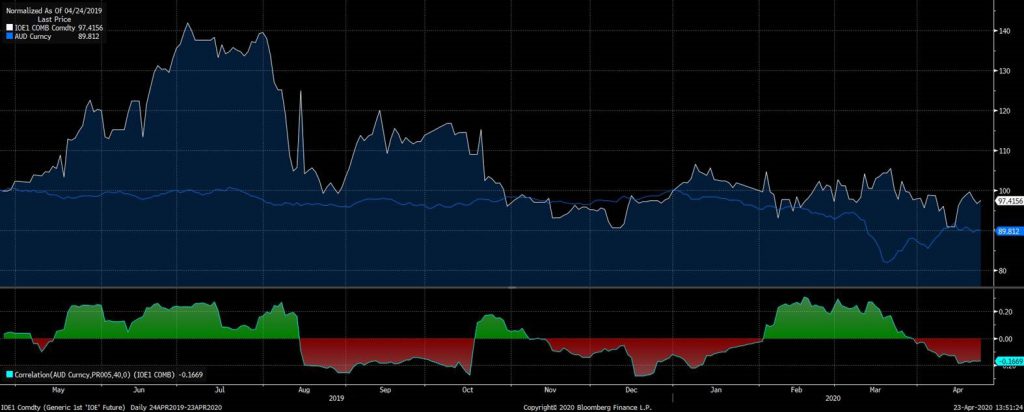
Of course, Iron Ore is our 2nd largest export (just pipped by coal) and even that correlation is, if anything, virtually non-existent as a net over the year.
The very long point I’m trying to get to is overnight, the explanation of Oil rallying, thus S&P rallying thus AUD rallying is to be taken with a grain of gold. It’s human nature to create an exact science where one thing affects another – or at least for traders, but realities is it comes down to cross-border flow and speculation that drives currencies. That’s not to say we can’t extract analogues in prior moves – i.e. GFC reaction vs COVID19, but alike technical, it’s not the sole determinant of where a currency will go.
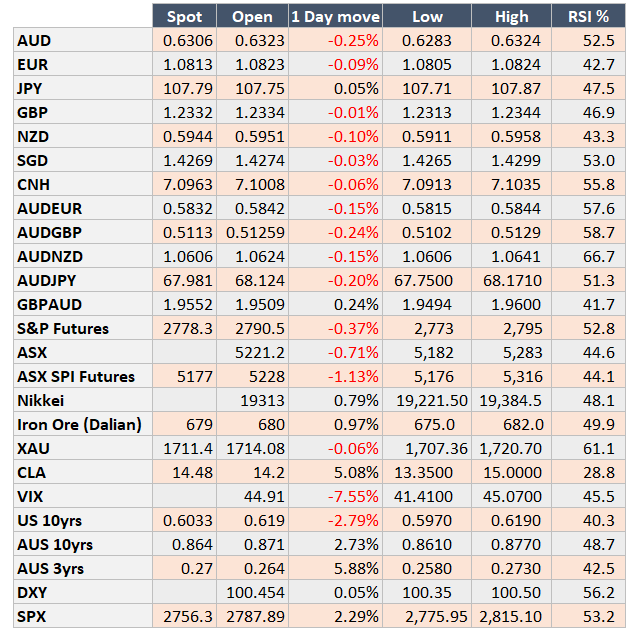
Then there’s Europe… well bless their glacial ways in solving a problem, it’s accepted Junk Bonds as collateral – essentially in case a bond gets downgraded before September 2021. Markets though aren’t satisfied and EUR fell to 1.0806 – again it’s stuck in Safe Haven status vs the usual political issues when so many cultures come to the table (think Grexit, Brexit, PIIGS etc). Longer term, unless Europe can step up and respond in a timely manner, this will be the currency to sell once the dust settles.
Top Panel: AUD (White) S&P (Blue) Oil (Orange) normalised to 100
2nd Panel: S&P correlation to AUD
3rd Panel: S&P correlation to Oil
4th Panel: Oil correlation to AUD
Gold (White) AUD (Blue) normalised to 100 in the top panel, then correlation below it.
Iron Ore (White) AUD (Blue) normalised to 100 top panel, then correlated 2nd panel.
Contact the Inside Track Research Team for more info: +61 2 8916 6115